Onboarding and activation
The path from account creation to the first moment the product is demonstrably useful, including the sample data and empty states most teams skip.
Design
An engagement that ends in a beautiful Figma file and no metric movement wasted everyone's quarter. We start from where users currently stop.
Onboarding and activation flows
Interfaces that survive real data volumes
Designed against your analytics
The path from account creation to the first moment the product is demonstrably useful, including the sample data and empty states most teams skip.
The three or four things users do weekly, designed to be fast on the hundredth repetition rather than impressive on the first.
Tables, filters, and dashboards that stay legible when a customer has forty thousand rows instead of the twelve in your demo.
Pricing, upgrade prompts, and billing designed to be clear rather than manipulative — dark patterns cost more in churn than they earn in conversion.
The demo is compelling. The signup works. Then the new user lands in an empty product with no obvious next action and closes the tab. That gap between signing up and getting value is where retention is won or lost, and it is consistently the highest-leverage thing to fix.
It is also among the cheapest, because it rarely needs new features. It needs sample data, a clear first action, and an empty state that teaches rather than apologises.
Designing without knowing where users currently stop is guessing expensively. Before any screens we want your funnel data, a handful of session recordings, and access to whoever reads your support tickets.
That usually makes the real problem obvious within an hour, and it is rarely the thing the team assumed it was.
Week 1
Review analytics, recordings, and tickets. Identify the two surfaces with the clearest revenue consequence and instrument anything not already measured.
Weeks 1–2
Not the biggest — the one where a change is most likely to move a number. Usually onboarding.
Ongoing
Because this runs inside a subscription rather than a fixed project, a design that does not move the metric gets revised instead of defended.
Month 2 onwards
Patterns that prove out become components, so the next screen is assembly rather than a fresh design problem.
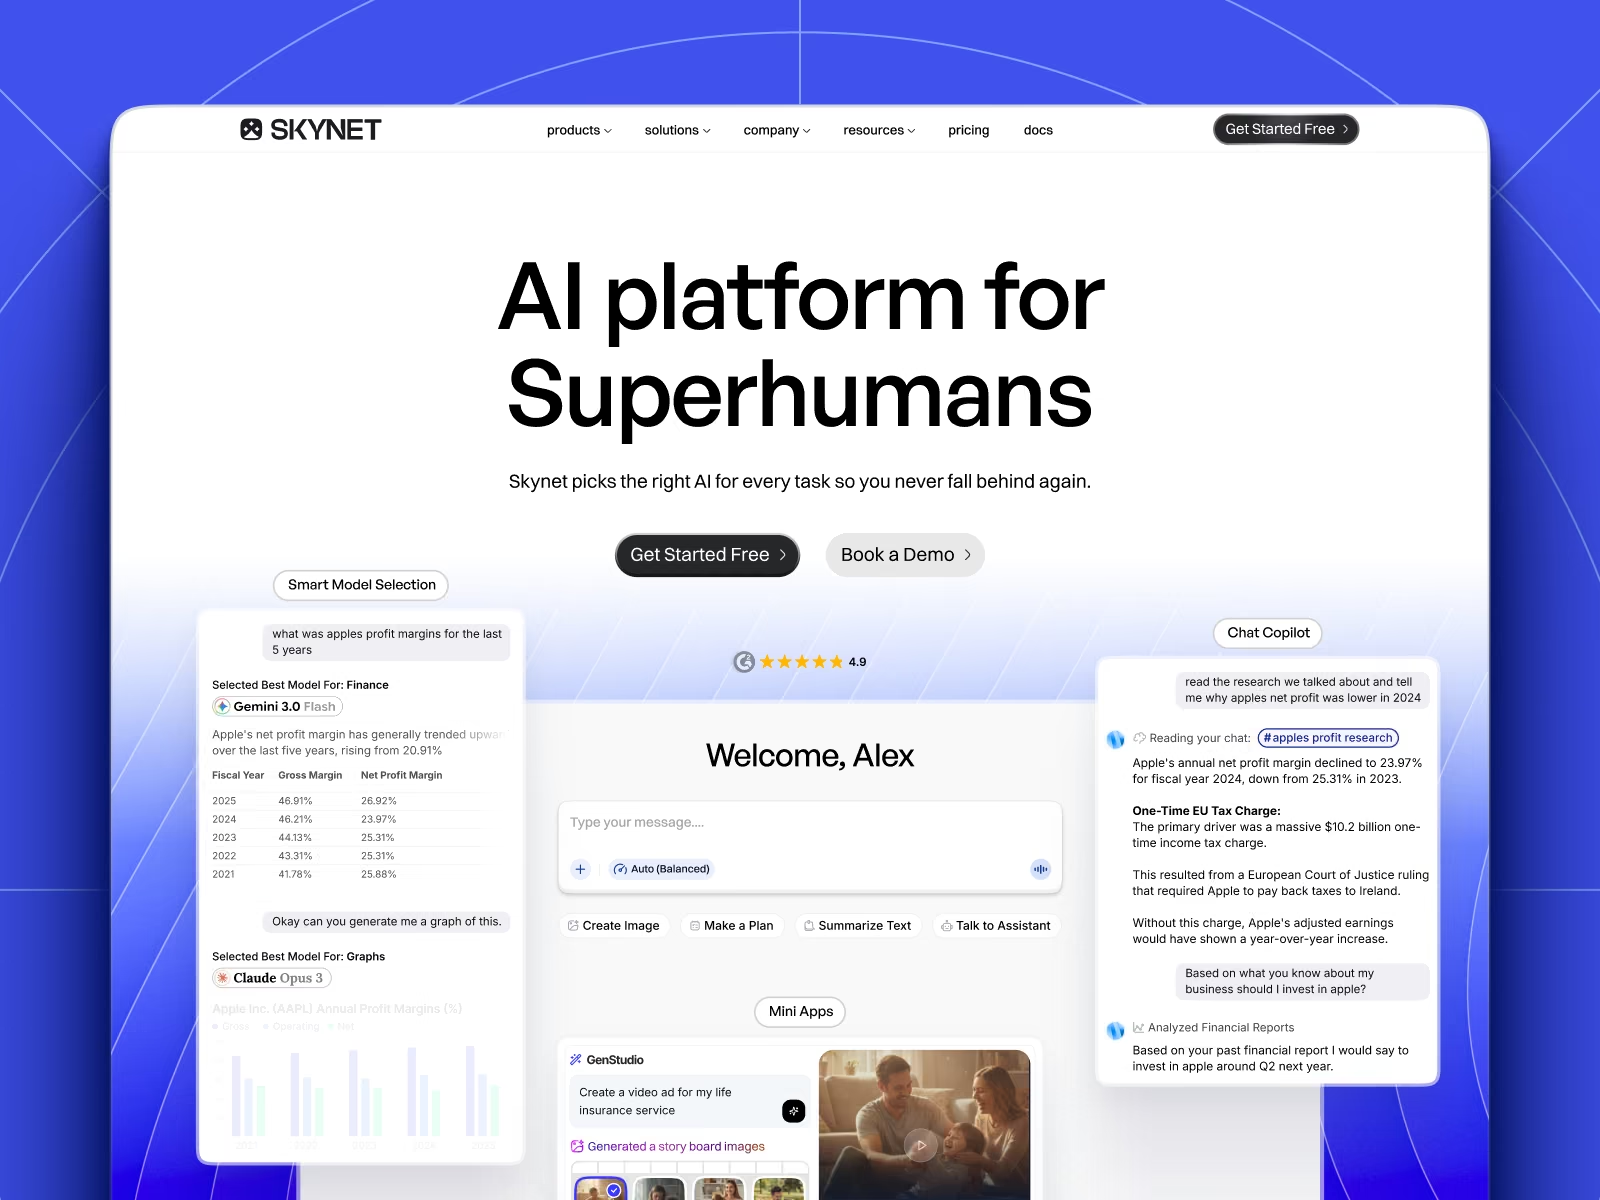
Skynet
Brand identity, marketing site, and product design for Skynet, an AI platform that routes every task to the right model across 20+ providers.
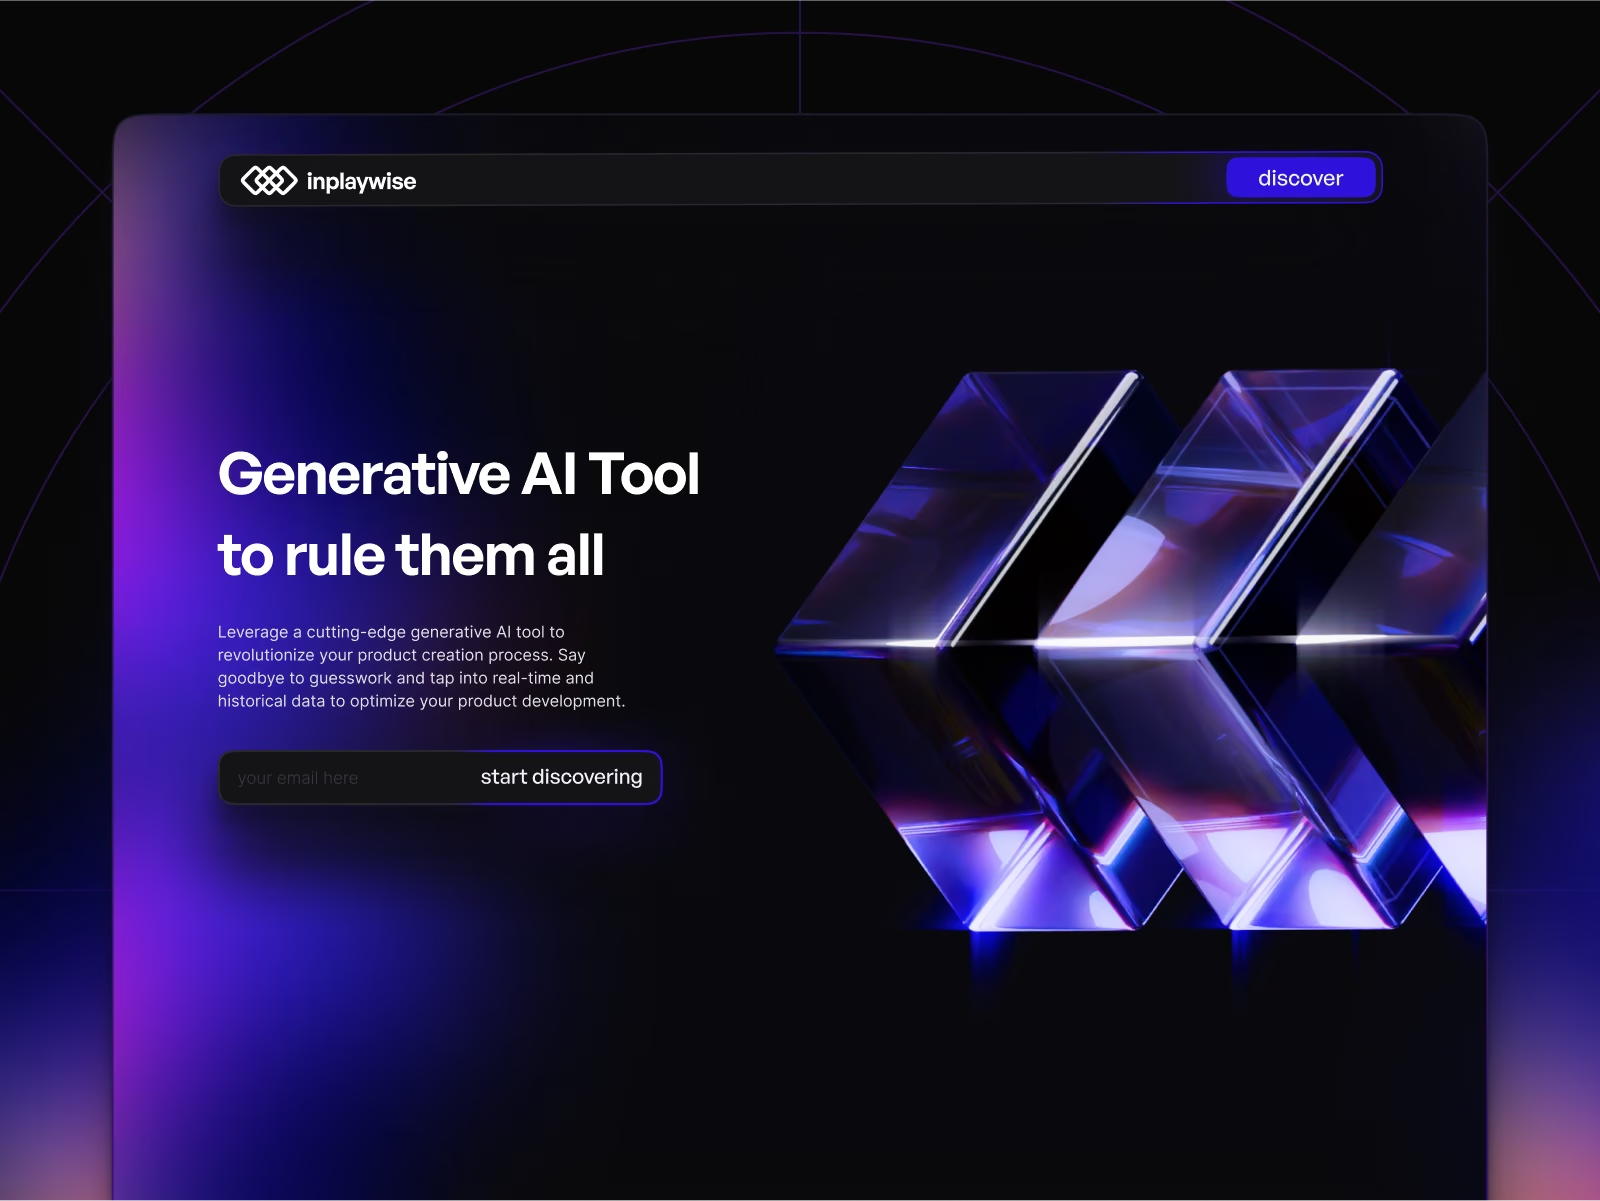
InPlayWise
Brand, site, and product design for InPlayWise, an AI platform surfacing live in-play sports signals for bettors who decide in seconds.
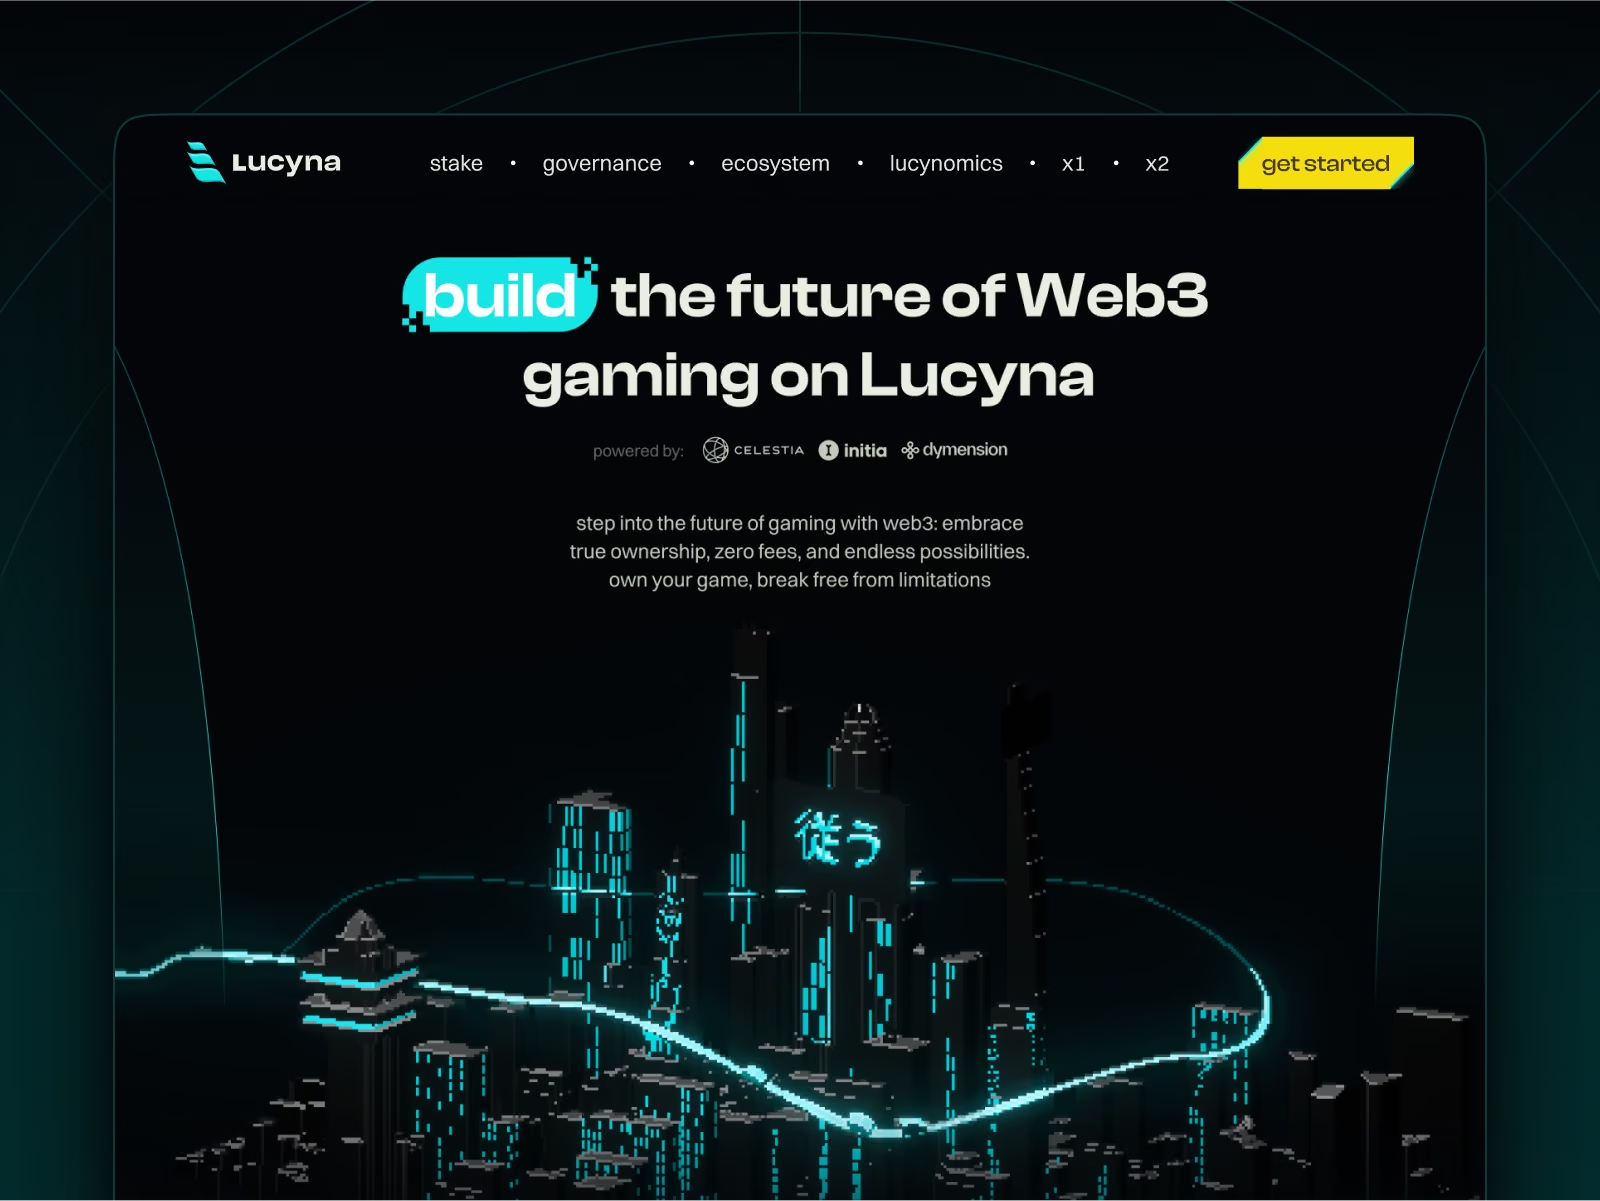
Lucyna Network
Brand, site, and product surfaces for Lucyna, an ecosystem of modular gaming rollups built on Celestia, Dymension, and Initia.
Mostly existing. Redesigning a product with real users and real data is harder and considerably more useful than greenfield work.
Yes, and that is the normal setup. We join your planning rhythm rather than running a parallel process alongside it.
We instrument the surfaces the work depends on as part of the engagement. Designing without measurement is the thing we are trying to avoid, so this comes first.
On the design and development plan, yes. Otherwise we hand off to your team with documented components and specs.
One flat monthly fee. Unlimited requests. Design and engineering under one roof — pause or cancel whenever you like.